 |
| This Pie Graph show that Cocaine is about the 3rd most used drug in the United States. |
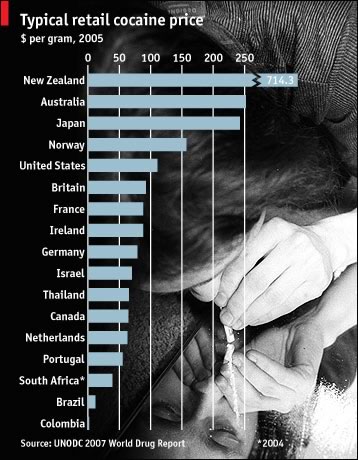 |
| This bar graph is stating that the US is the 5th country with the most expensive cocaine at about 100 dollars per gram in 2007. This also could prove a trend of supply and demand. The reason the price is so high is because there is a high demand but less supply. |
 |
| This picture is from a case involving a college male who was setting up drug deals online. It shows to us that now drugs are being distributed easier through the internet and it also makes them easier to be caught. |
 |
| This chart shows that Cocaine use has spread to schools and younger generations in Florida. |
No comments:
Post a Comment